How Jafra works
Jafra coordinates three distinct responsibilities: async-profiler records JVM events, node-local Agents collect completed JFR chunks, and the Analyzer applies JDK Mission Control rules. Application teams get continuous evidence without packaging recording infrastructure into every service.
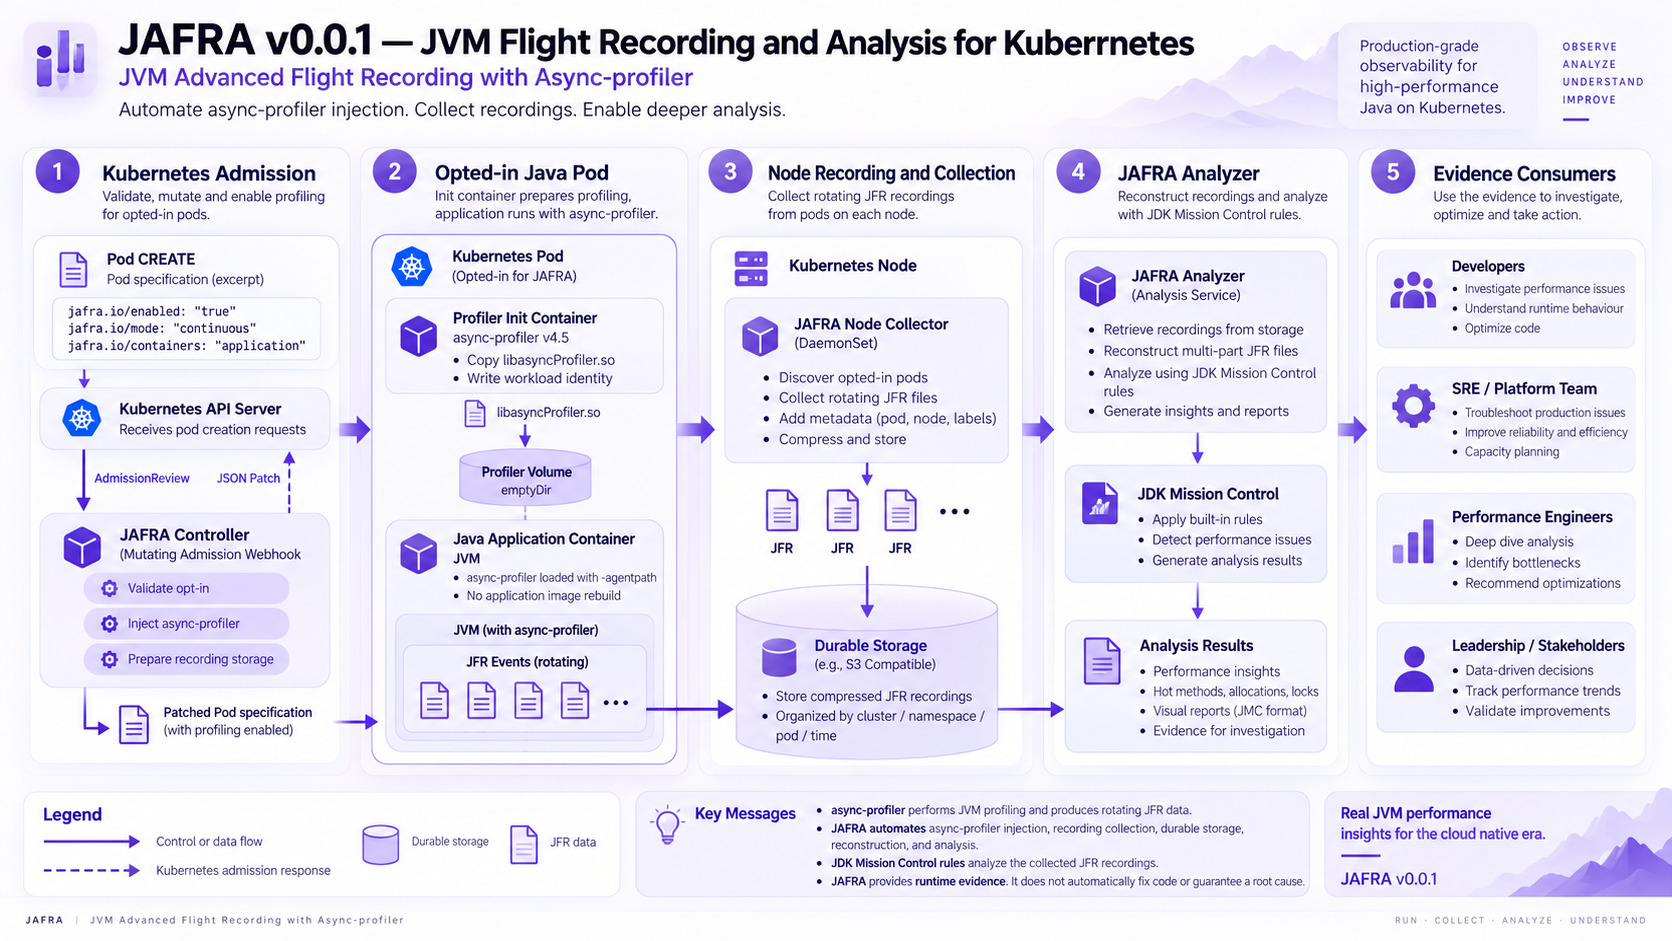
1. Opt in a workload
You select a Java workload using labels and annotations on its Pod template. When Kubernetes creates the Pod, the Jafra Controller validates that configuration and adds everything async-profiler needs to start recording:
- an init container carrying async-profiler v4.5;
- an
emptyDirforlibasyncProfiler.so; - a node
hostPathrooted at/var/lib/jafra/recordings; - a per-container
/jfr-datamount; - downward-API identity variables;
- an async-profiler
-agentpathoption inJAVA_TOOL_OPTIONS.
The workload image is not modified. The profiler is prepared by an init
container and loaded through JAVA_TOOL_OPTIONS when the JVM starts.
For each selected container, the controller creates:
<namespace>/<podUID>/<container>/
under the node recording root. The application sees this location as
/jfr-data and writes rotating profile-N.jfr files. Identity metadata
stored beside the files preserves the namespace, Pod, and container that
produced them.
2. Collect complete recording chunks
One Jafra Agent runs on each Linux node. It watches the shared recording tree and parses JFR headers to determine when a chunk is complete. It does not assume that a filesystem notification means the JVM has finished writing.
Chunks from different recordings can upload concurrently, while chunks from the same file remain ordered. Periodic rescans make collection resilient to missed or bursty filesystem events.
3. Store recordings centrally
The agent streams each chunk to the Jafra Analyzer over gRPC. The analyzer validates the upload sequence and SHA-256 checksum before acknowledging it. Retries are safe because every chunk has a deterministic identity and an already stored chunk is recognized as a duplicate.
Accepted chunks are stored on the analyzer PVC. Contiguous chunks are reconstructed into recordings that can be queried by namespace, Pod, and container.
4. Turn recordings into operational evidence
The Analyzer HTTP API supports two complementary views:
- Automated reports run JDK Mission Control rules and return scored findings by topic.
- Event summaries aggregate the raw event types present in a recording, including useful numeric and text fields.
Both views can target a recording or a time window, making them suitable for incident investigation and repeatable operational tooling.
Reliability model
- A source rotation remains on its node until every complete chunk is acknowledged and a newer rotation exists.
- Agent restarts can cause a retry, but durable analyzer identities prevent a duplicate recording from being stored.
- Analyzer recovery removes incomplete transfers, reloads committed chunk metadata, and rebuilds recordings.
- In v0.0.1, analyzer durability is provided by a single ReadWriteOnce PVC.